Power, Water, and Local Pushback: The Hidden Constraints on AI Campuses
AI data center opposition is rising over power, water and grid delays. How cooling, interconnection queues and PPAs reshape AI campus energy strategy.
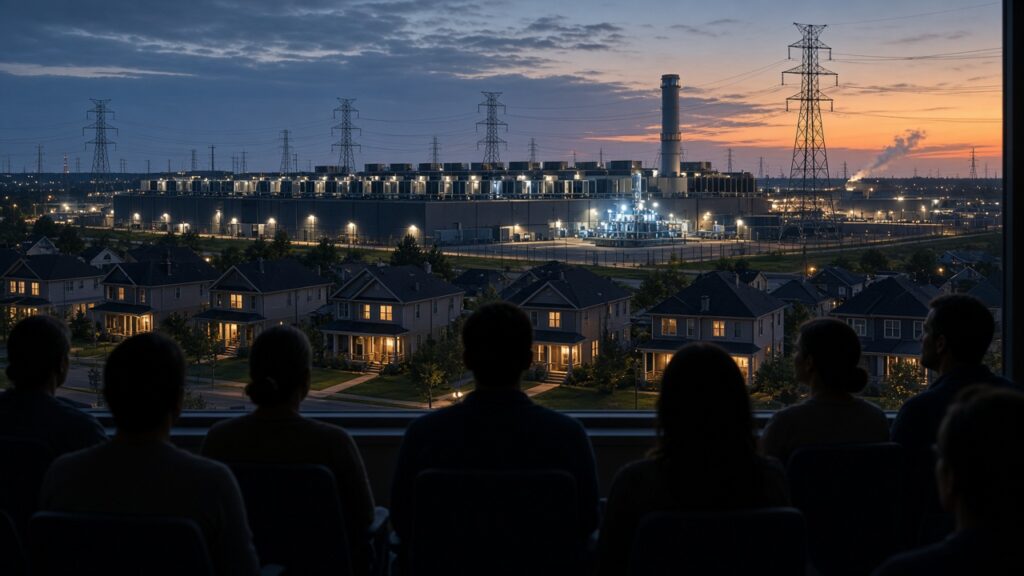
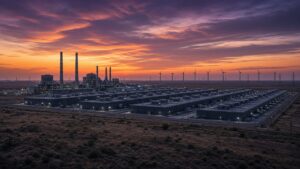
Chip supply, model rankings, and capital expenditure dominate AI headlines. On the ground, a quieter set of constraints is deciding which campuses actually get built: local zoning fights, scarce cooling water, multi-year grid interconnection queues, and the fine print of power purchase agreements (PPAs). Together they form the hidden stack beneath AI campus energy—and they explain why AI data center opposition has become a material project risk, not a public-relations footnote.
From “digital warehouses” to contested infrastructure
For two decades, data centres expanded as relatively quiet industrial neighbours. The AI era changed the optics. Facilities now ask for hundreds of megawatts, taller shells, denser cooling plants, and new substations. In Northern Virginia—long branded the world’s data-centre capital—counties that once allowed many projects “by right” have tightened rules. Loudoun County moved to require special exceptions for new data centres; Fairfax County amended its zoning ordinance in 2024 to shrink by-right envelopes, increase residential setbacks, and require noise studies. In Prince William County, a circuit court ruling voided approval of the massive Digital Gateway rezoning after residents challenged how hearings were advertised. In Fauquier County, developers have introduced water and power proffers—and, in some cases, withdrawn applications after planning commissions and neighbours pushed back.
The pattern is no longer regional. Data Center Watch, a research project affiliated with 10a Labs, reported that roughly $64 billion in U.S. data-centre projects were blocked or delayed amid local opposition over a May 2024–March 2025 window (about $18 billion blocked and $46 billion delayed in its framing), with at least 142 activist groups tracked across 24 states. A later Data Center Watch update covering late March through June 2025 put newly blocked or delayed project value at about $98 billion for that shorter stretch alone—figures that should be read with the group’s own caveats that opposition is one factor among regulatory, utility, and market risks, and that “blocked” can include relocated proposals. Even with those methodological notes, the direction is clear: AI data center opposition now travels with the buildout.
Common grievances recur across red and blue jurisdictions: higher household utility bills if network upgrades are socialised; data center power water demand in drought-prone basins; diesel-generator noise and low-frequency hum; property-value fears; and the visual and ecological cost of transmission corridors. When developers add onsite gas turbines to bypass the queue, opposition often expands from the server hall to the power plant next door.
The power constraint: queues, transformers, and “queue inflation”
The International Energy Agency’s Energy and AI work estimated that, unless risks are addressed, around 20% of planned data-centre projects could face delay—and that building new transmission in advanced economies often takes four to eight years, while wait times for transformers and cables have roughly doubled in three years. Follow-on IEA analysis in Key Questions on Energy and AI and Powering Artificial Intelligence sharpens the picture: grid-connection waits of five to ten years appear in many jurisdictions; transformer lead times commonly stretch two to three years; gas-turbine deliveries can approach about five years.
Europe’s hubs show how local the bottleneck becomes. Ember’s grid analysis notes that in 2023 data centres already accounted for roughly 33–42% of electricity demand in Amsterdam, London, and Frankfurt, and nearly 80% in Dublin—and that primary-market connection waits of seven to ten years, occasionally up to 13, deter developers even when land is available.
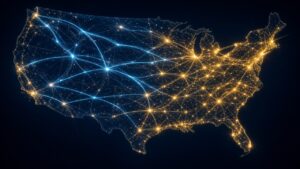
“Queue inflation” compounds planning chaos. Network operators in places such as Texas, Virginia, Finland, and the United Kingdom have reported connection queues whose cumulative capacity can exceed today’s peak demand. Speculative and duplicate applications sit beside real hyperscale loads. Overbuild the grid and ratepayers risk stranded assets; underbuild and AI campuses slip years. That uncertainty is why AI Hyperscale Infrastructure siting has shifted from fibre density alone to a triad of megawatts available by date, upgrade cost allocation, and political durability of the interconnect.
Hyperscalers respond with PPAs for existing nuclear and renewables, behind- or front-of-the-meter structures with generators, and—especially in the United States—a growing pipeline of onsite natural gas. IEA tracking suggests a non-trivial share of U.S. projects with onsite gas have begun land clearing or construction, yet the agency also warns that reliable onsite gas for variable critical load may require overbuilding generation by roughly 30–70% relative to demand. In a turbine supply crunch, “bring your own megawatts” is not automatically faster than waiting for the wire.
The water constraint: cooling’s other meter
Electricity is only half of the data center power water nexus. Removing heat from dense AI racks still relies heavily on evaporative and hybrid cooling in many climates. IEA-linked illustrations cited in U.S. Congressional Research Service material put a 100 MW U.S. data centre at roughly 2 million liters per day of water use averaged across cooling strategies, of which on the order of 725,000 liters per day may be consumed on site. Industry and policy papers describe large hyperscale campuses whose cooling water demand can reach tens of thousands of cubic metres per day under water-intensive designs. Globally, IEA-referenced figures place data-centre water use around 560 billion liters per year, with pathways toward roughly 1.2 trillion liters by 2030 if growth outruns efficiency.
Geography makes the risk acute. IEA analysis of AI-dedicated capacity finds that nearly 40% of identified capacity sits in areas with high or extremely high baseline water stress. That is not an abstract ESG score: it is a permitting veto waiting to happen when municipal utilities, farmers, and campuses compete for the same aquifer or river rights.
There is also a hard engineering trade-off. Cooling that saves water (dry coolers, many air-side designs, some closed loops) often burns more electricity; evaporative systems that cut power draw consume more water. Liquid cooling—direct-to-chip and immersion—improves thermal density and can shrink facility water intensity, but it shifts capital cost, maintenance skills, and sometimes the heat-rejection problem to a different loop. Developers in contested Virginia markets have increasingly promised closed-loop systems that limit potable or groundwater use for cooling to office-like volumes; neighbours still ask who verifies those claims once GPUs densify and summer peaks arrive.
Upstream water embedded in power generation matters too. A campus that looks frugal on site can still drive large evaporative losses at thermal power plants if its electrons come from steam cycles. Renewable PPAs and nuclear attributes change that footprint; gas peakers and older thermal fleets do not.
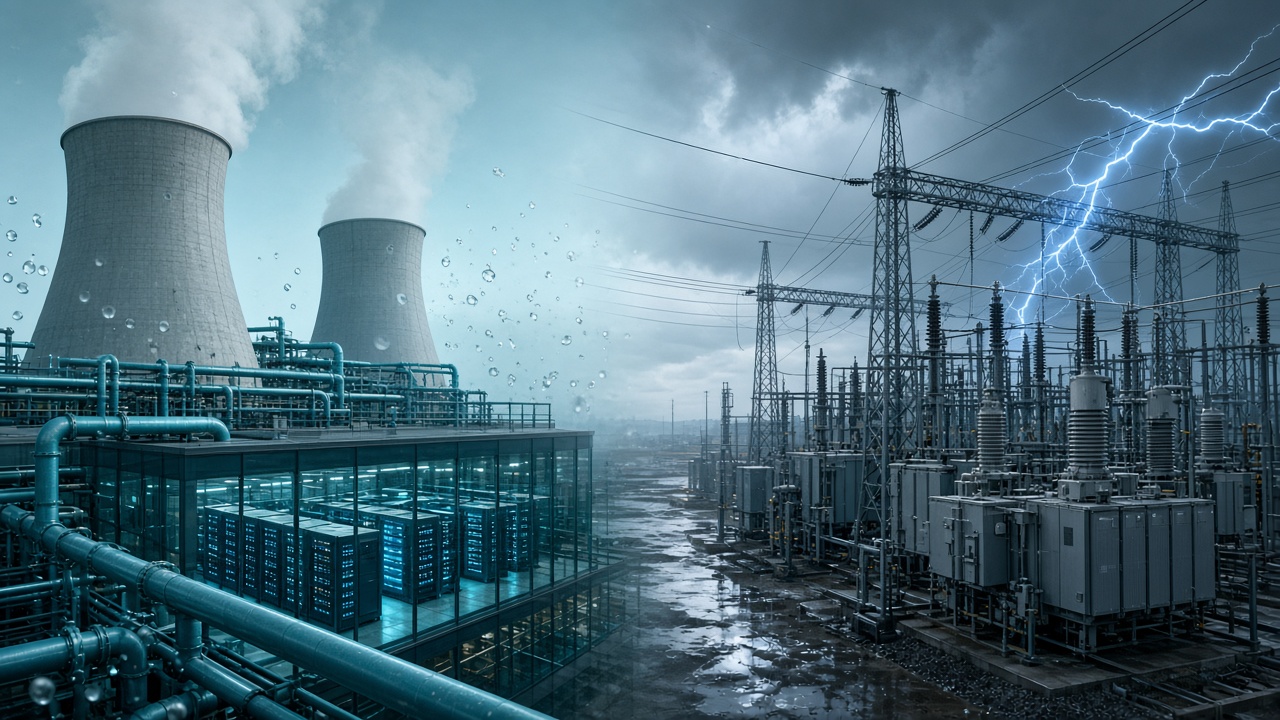
PPAs: buying electrons is not the same as clearing constraints
Long-term PPAs with utilities and independent generators—nuclear restarts, wind and solar portfolios, corporate SMR offtake—are now standard tools for hyperscale AI campus energy strategy. They help with carbon accounting, price hedges, and headline megawatts. They do not automatically unlock a local transformer, a municipal water permit, or a county special exception.
Three PPA realities keep colliding with campus timelines:
- Deliverability basis. A PPA for attributes or system power may not guarantee that the specific campus feeder can accept load on the contracted date.
- Cost socialisation politics. If transmission and distribution upgrades appear on household bills, local opposition intensifies even when the hyperscaler “paid for clean power.” Advocacy groups in Virginia have argued that data centres—not taxpayers—should bear the bulk of new infrastructure costs.
- Co-location optics. Pairing campuses with nuclear or gas plants can shorten electrical distance and firm supply, yet it concentrates industrial impacts—noise, security perimeters, cooling plumes—exactly where activism is easiest to organise.
Smart offtake design increasingly ties PPA milestones to interconnection studies, water rights, and zoning conditions. Without that linkage, CFOs discover they own a green contract and a brownfield delay.
Local pushback as a design input, not a surprise
The most sophisticated operators now treat community risk the way they treat latency: measure it early. Patterns that reduce friction include:
- Honest load and water disclosure in public hearings, including summer peaks and diesel-test schedules.
- Setbacks, undergrounding, and noise envelopes that exceed minimum code when residences are adjacent.
- Non-potable and recycled water pathways where utilities can supply them.
- Flexible load and storage that let campuses curtail or shift non-critical compute when the grid is stressed—still underexploited, the IEA notes, because AI halls are extremely capital-intensive to idle.
- Site selection outside saturated clusters. IEA reporting that roughly half of U.S. data centres under development sit in pre-existing large clusters helps explain why Loudoun-style politics migrate to the next county—and why secondary markets suddenly matter.
None of this eliminates opposition. It changes the hit rate. Data Center Watch’s tracking of petitions, lawsuits, and moratoria (including multi-month pauses in metro Atlanta suburbs and similar measures elsewhere) shows that silence-and-speed strategies fail more often as media attention rises.
Why “Space Computing” enters the conversation
The Space Computing badge is not a gimmick beside cooling towers. As terrestrial campuses hit simultaneous walls—water stress, interconnection queues, and neighbourhood vetoes—research and venture interest in orbital and edge-compute architectures has shifted from science fiction to contingency planning. Radiative cooling in vacuum, solar collection above the atmosphere, and latency-tolerant batch workloads are genuine physics advantages. They do not, in 2026, replace a 300 MW training cluster in Virginia or Dublin. They do signal how seriously infrastructure planners take the idea that the binding constraint on AI may be place, not silicon.
For AndBeyond.Tech readers, the practical takeaway is comparative: every month lost to a substation appeal or a water-right hearing is a month in which alternative topologies—including high-altitude and space-adjacent compute concepts—look relatively less speculative. Terrestrial AI Hyperscale Infrastructure remains the workhorse; space computing is the pressure gauge.
What “enough” looks like for policymakers and builders
If the goal is to expand AI capacity without exporting crises to the next zip code, several levers show up repeatedly in IEA and local-government practice:
- Queue reform that prioritises ready projects, deposits, and demonstrated load over speculative placeholders.
- Transparent cost allocation so households see what campuses fund directly.
- Joint power–water permitting that forces the energy–water trade-off into the open instead of serial surprises.
- Efficiency standards that recognise equipment gains while remaining cautious about brittle model-level rules the IEA itself flags as hard to set.
- Strategic siting toward grids and basins with headroom—even when land is cheaper elsewhere.
Builders who treat megawatts as the only scarce resource will keep losing years to the second and third meters: water and trust.
Bottom line
The hidden constraints on AI campuses are no longer hidden to the communities that host them. Power arrives late when transformers, turbines, and transmission clocks run slower than GPU roadmaps. Water arrives contested when nearly two-fifths of identified AI capacity maps onto high water-stress regions and cooling choices trade litres for kilowatts. Local pushback converts those physical limits into calendar delays measured in billions of dollars of blocked or deferred projects. PPAs can hedge price and carbon; they cannot, alone, buy a feeder, a well permit, or a zoning vote.
For operators, the winning AI campus energy strategy in the late 2020s is therefore portfolio-shaped: firm clean offtake, liquid-ready cooling, interconnection realism, and community design that assumes scrutiny. For everyone else watching the AI boom, the lesson is simpler. The next bottleneck after chips may not be a model architecture at all—it may be a county board meeting, a dry summer, and a five-year wait for a transformer.
Related reading
- Can Nuclear Power AI in Time? SMRs, Large Reactors, and the 2030 Gap
- The Texas AI Factory Race: Why Hyperscalers Are Betting Tens of Billions on One State
- Microsoft Fairwater and the Rise of the Distributed AI Superfactory
References / sources
- International Energy Agency — Energy and AI, Executive summary (grid delays ~20% of projects; transmission 4–8 years): https://www.iea.org/reports/energy-and-ai/executive-summary
- International Energy Agency — Powering Artificial Intelligence, Executive summary (queue inflation; ~40% of AI capacity in high/extremely high water stress): https://www.iea.org/reports/powering-artificial-intelligence/executive-summary
- International Energy Agency — Key Questions on Energy and AI, Executive summary (connection waits; onsite gas overbuild 30–70%): https://www.iea.org/reports/key-questions-on-energy-and-ai/executive-summary
- International Energy Agency — news update on 2025 data-centre electricity surge and bottlenecks: https://www.iea.org/news/data-centre-electricity-use-surged-in-2025-even-with-tightening-bottlenecks-driving-a-scramble-for-solutions
- Data Center Watch — report on ~$64B U.S. projects blocked or delayed amid local opposition: https://www.datacenterwatch.org/report
- Data Center Dynamics — coverage of Data Center Watch $64bn findings and methodology caveats: https://www.datacenterdynamics.com/en/news/group-claims-64bn-in-us-data-center-projects-impacted-by-local-opposition-in-last-two-years/
- WIRED — Data Center Watch Q2 2025 update (~$98B blocked/delayed March–June 2025): https://www.wired.com/story/the-data-center-resistance-has-arrived/
- Fierce Network — Northern Virginia zoning pushback (Loudoun special exception; Fairfax 2024 amendments; Digital Gateway litigation): https://www.fierce-network.com/cloud/data-center-capital-world-says-enough
- Potomac Local — Virginia reform push and Digital Gateway court setback: https://www.potomaclocal.com/2025/08/21/big-push-to-rein-in-virginias-data-center-boom/
- Fauquier Now — Catlett Station proffers amid opposition (closed-loop cooling claims; power/water concerns): https://www.fauquiernow.com/news/headwaters-introduces-proffers-for-catlett-station-data-center-project-amid-community-opposition/article_25696442-1d76-11ef-94b1-8ffeb6903db6.html
- Annandale Today — Plaza 500 / Bren Mar community rally on water, energy, substations: https://annandaletoday.com/community-speaks-out-against-plaza-500-data-center/
- Congressional Research Service — Data Centers and Their Energy Consumption: Frequently Asked Questions (IEA-cited ~2M liters/day for 100 MW illustration): https://www.congress.gov/crs-product/R48646
- Ember — Grids for data centres in Europe (hub demand shares; 7–13 year connection waits): https://ember-energy.org/app/uploads/2025/06/Grids-for-data-centres-in-Europe.pdf
- Desert Research Institute report citing IEA water/electricity figures for U.S. hyperscale contexts: https://www.dri.edu/wp-content/uploads/Data-Center-Report-Final-2.pdf
Images: original illustrations generated for AndBeyond.Tech; no logos or real people depicted.